Wang Group

Overview

POLYMER

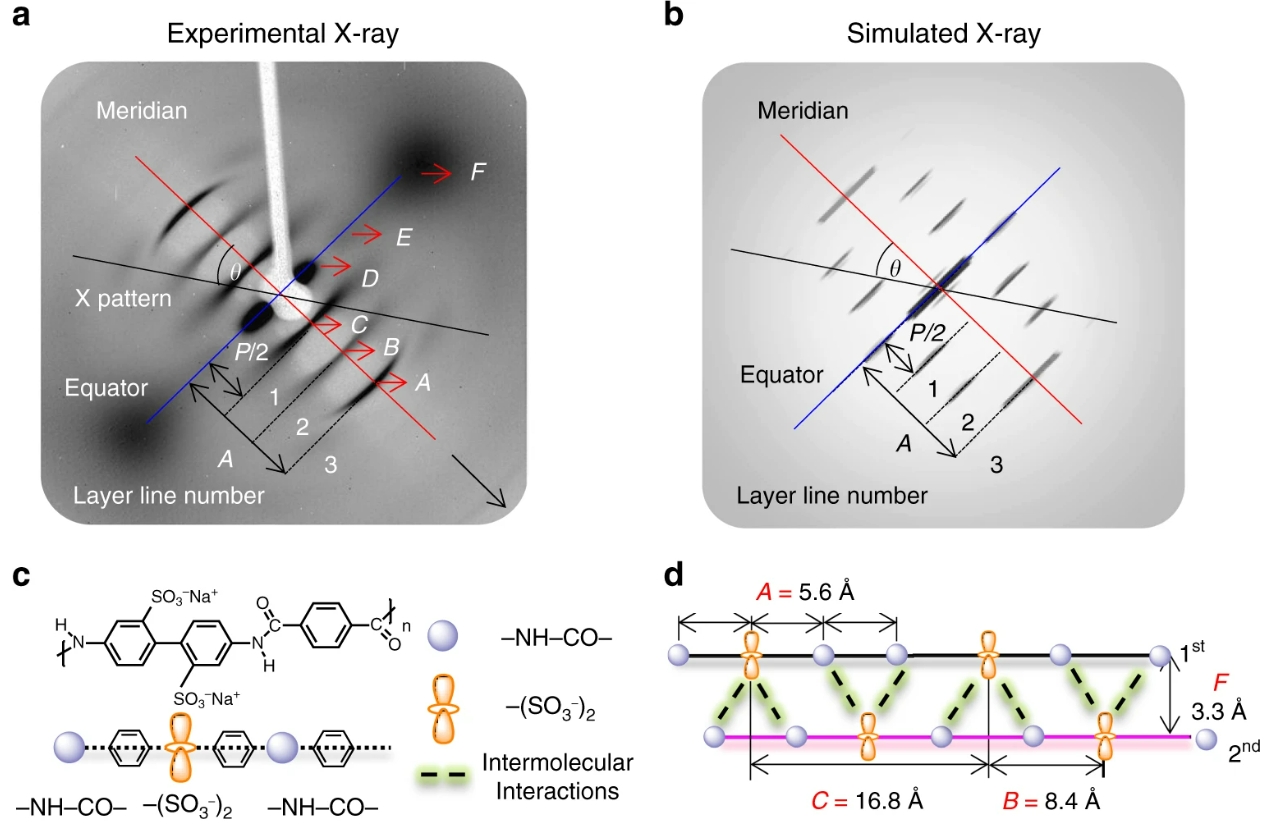
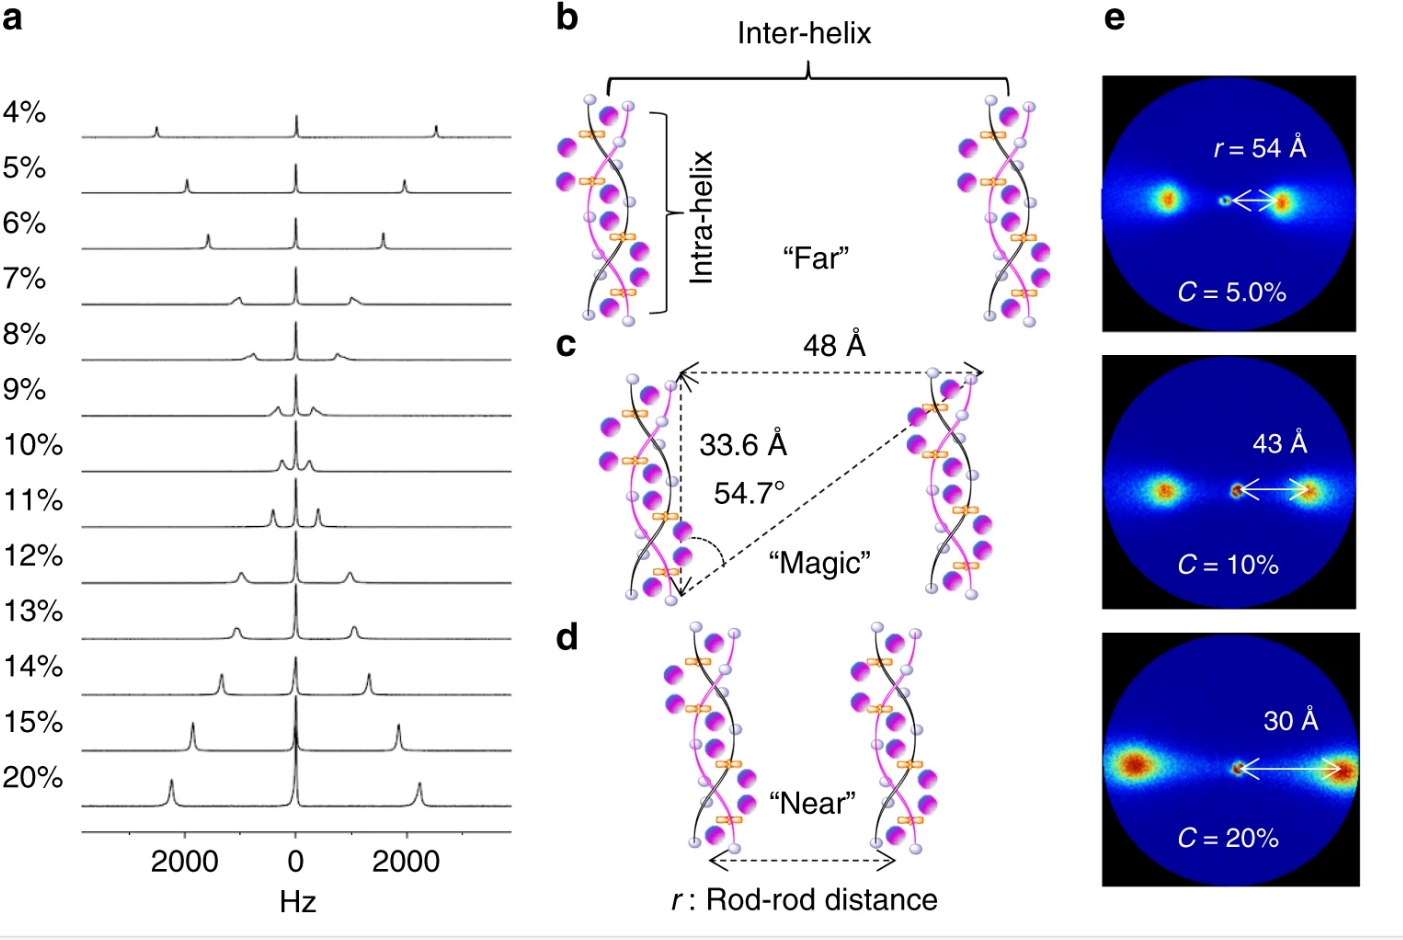
Polymer synthesis and self-assembly behavior and dynamics

Electrolytes

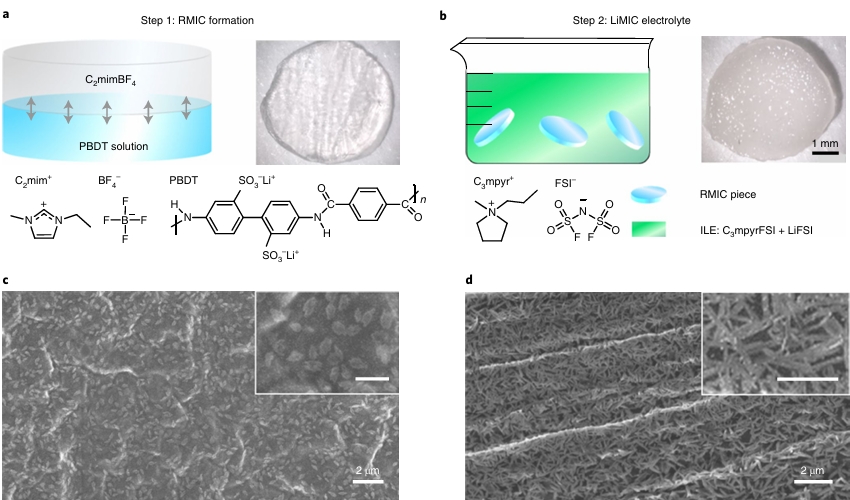
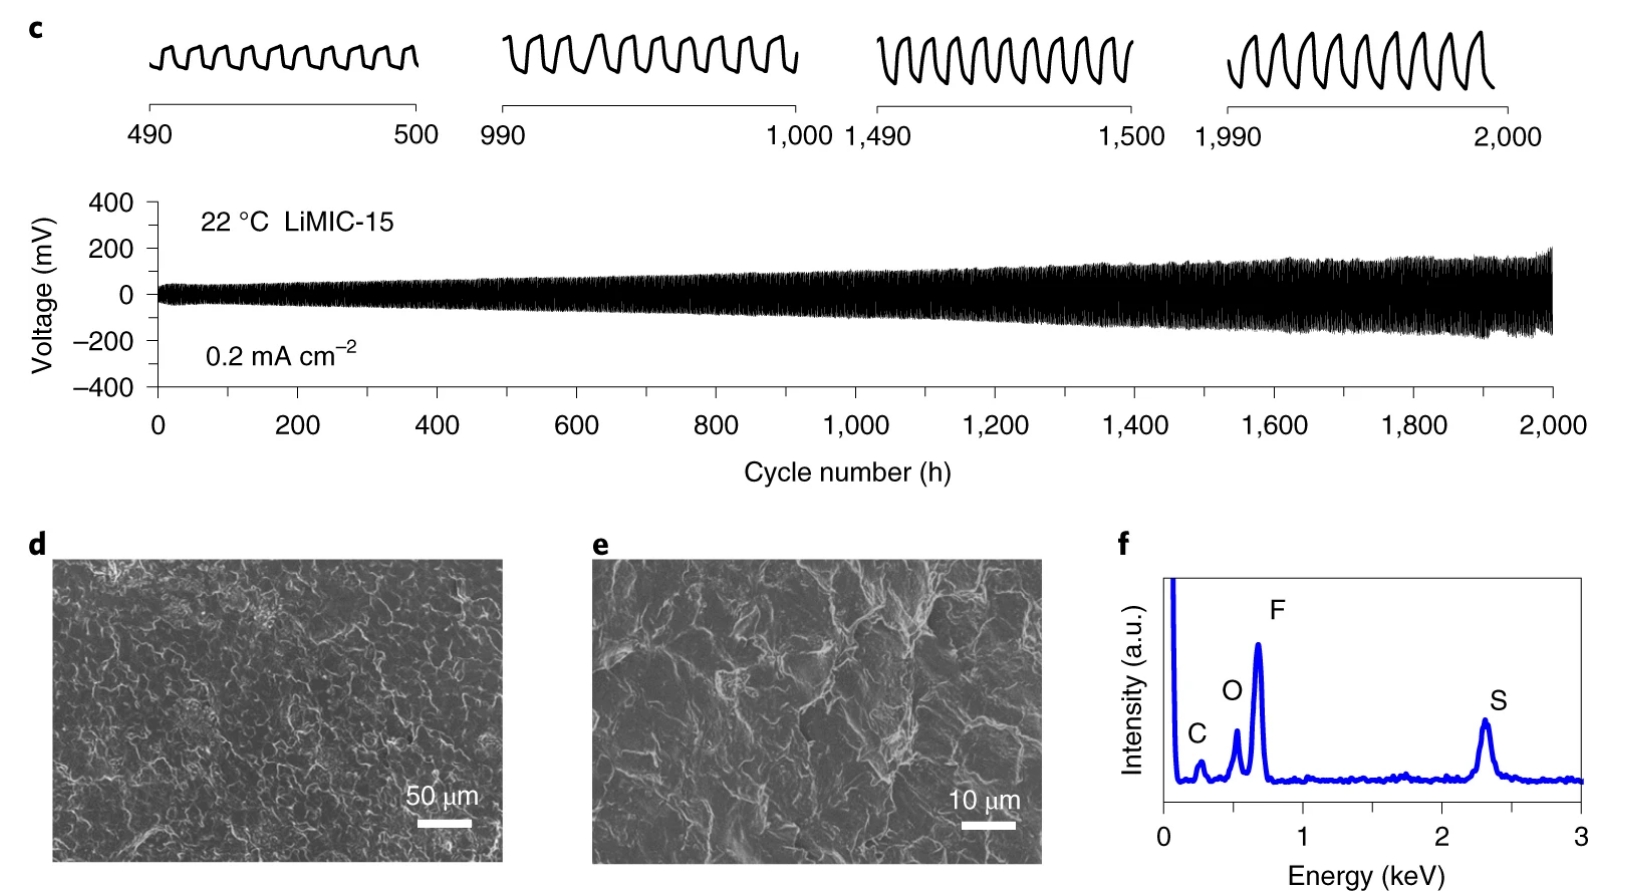
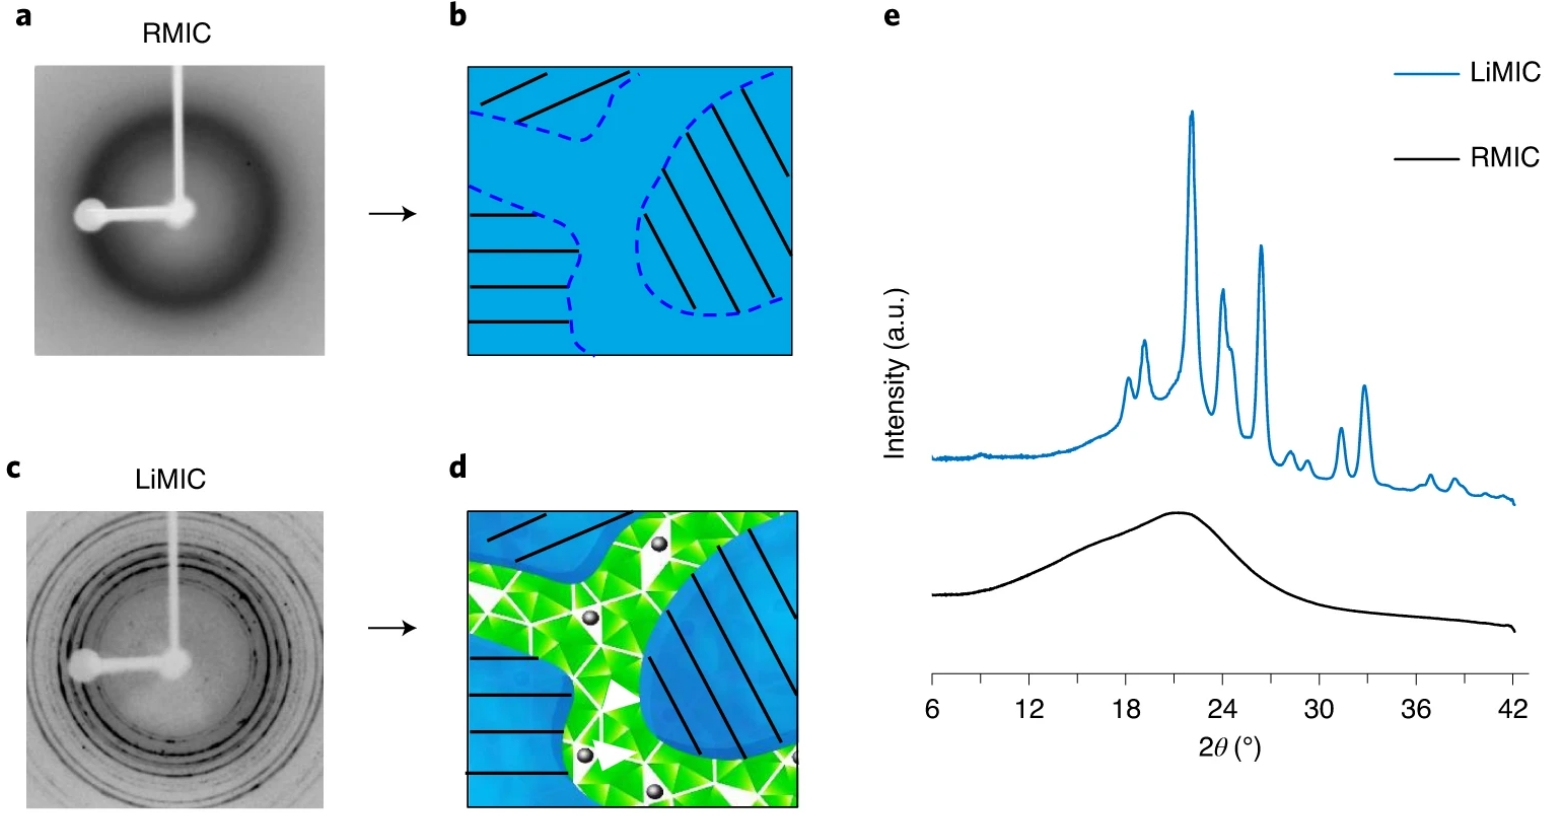
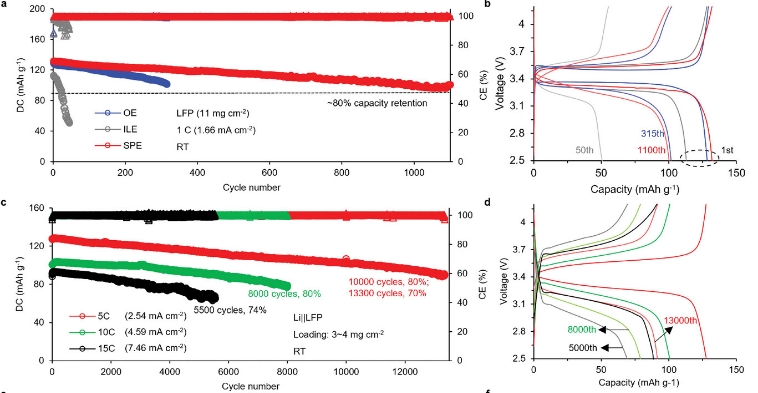
Development and characterization of solid-state polymer electrolytes

Mechanism

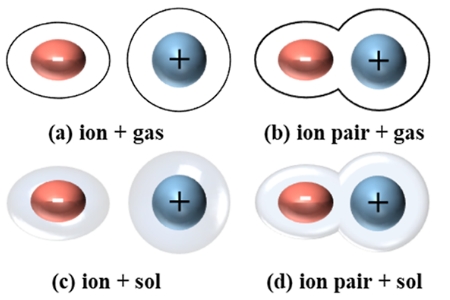
Investigation of ion transport and phase transition in solid-state electrolytes
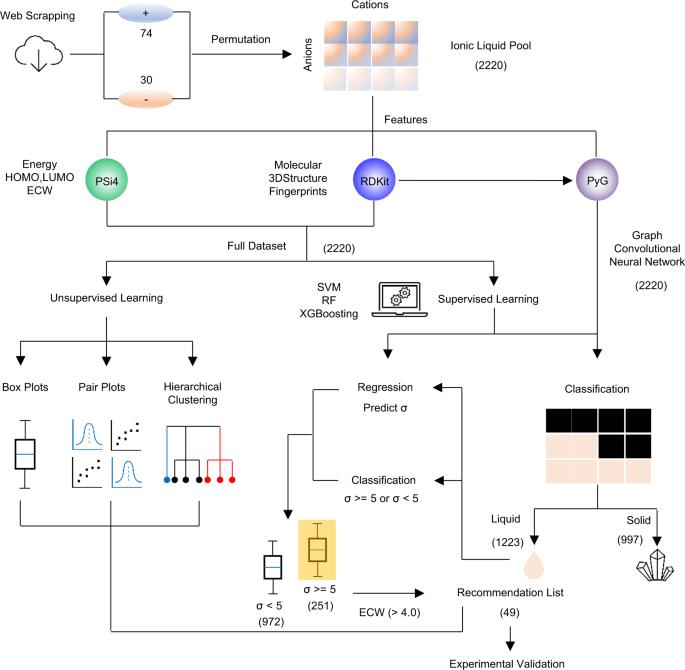
AI/ML

Integrate AI/ML into material science

Polymer

Research Image 1 View Image
An X-ray diffraction pattern for 20 wt% PBDT aqueous solution. The main diffractions are labeled A, B, C, D, E, and F and the helix tilt angle is θ. b The simulated X-ray diffraction pattern based on the HELIX software package (see also Supplementary Figure 1). The layer lines 1, 2, and 3 in the simulated results clearly mimic the experimental results. c The chemical repeat unit of PBDT includes one set of –SO3− groups (two sulfonate groups from one biphenyl unit) and two –NHCO– groups, each of which are mutually connected by one benzene ring. d The second PDBT strand is shifted 8.4 Å (B = P/4) away from the first strand along the helix axis. Numerous intermolecular interactions between chains (notably hydrogen bonding, dipole–dipole, and/or ion–dipole interactions between –SO3− and –NHCO– groups—shown as green dashed lines) and the rotation of each subunit contribute to the double helical conformation.
Research Image 2 View Image
Panel a shows concentration-dependent 23Na quadrupole spectra for PBDT solutions at 298 K. Panels b–d show configurations of PBDT self-assembly behavior with increasing concentration, and the critical geometric parameters at the null (isotropically averaged) point where Na+ shows isotropic dynamics are displayed in c. Intra-helical Na+ interactions dominate in b, the null point is at c and inter-helical Na+ interactions dominate in d. Panel e shows SAXS results for PBDT aqueous solutions with CPBDT =5%, 10%, and 20%.

Electrolytes

Research Image 1 View Image
a, Step 1 shows fabrication of the RMIC(Raw molecular ionic composite). We obtain this material based on an interfacial ion exchange between a water-soluble IL (for example, C2mimBF4) and an aqueous rigid-rod polyelectrolyte solution (Li-form PBDT in H2O). The photograph shows the sliced transparent RMIC sample. b, Step 2 shows the second ion-exchange process wherein we immerse a sliced section of the RMIC into the ILE (C3mpyrFSI with 50 mol% LiFSI). The photograph shows the sliced iridescent LiMIC sample. c,d, SEM images for RMIC-5 (c) and RMIC-15 (d). Higher magnification images are shown in the upper right insets. The scale bar for the insets is 1 μm. The interfaces between individual PBDT grains form the grain boundaries (darker regions). Both the aligned PBDT grains and the grain boundaries contain C2mimBF4
View Image Research Image 2
c,d) The long-term cycling performance and galvanostatic charge/discharge voltage profiles of Li||LiFePO4 full cells at 5 C (2.54 mA cm−2), 10 C (4.59 mA cm−2) and 15 C (7.46 mA cm−2) at RT. e) The high-rate and long-term cycling performance of PLMBs using SPEs in this study compared with other polymer electrolytes reported in the field (capacity retention limited above 80%), with the cathode loadings displayed as the bubble size. f) Compare the stable cycling number and current density of Li metal symmetric cells based on SPEs to other reported polymer electrolytes.

Mechanism

View Image Research Image 1
a, Powder X-ray diffraction pattern for the RMIC. b, In the RMIC, PBDT LC grains and grain boundaries, indicated with black solid and dashed lines, respectively, are filled with amorphous IL as a result of Step 1 of the fabrication process. c, X-ray diffraction pattern for the LiMIC. d, In the LiMIC, there exists an in-situ-formed and highly defective nanocrystalline structure between PBDT LC grains, indicated by the green shapes and black dots.
View Image Research Image 2
Long-term cycling performance of Li|SPEs|LiFePO4 cells. a) The discharge capacity and coulombic efficiency of the Li||LiFePO4 full cell (commercial cathode with high loading of 11 mg cm−2) using OEs, ILEs, and SPEs at room temperature at 1 C. b) The galvanostatic charge/discharge voltage profiles of a). c,d) The long-term cycling performance and galvanostatic charge/discharge voltage profiles of Li||LiFePO4 full cells at 5 C (2.54 mA cm−2), 10 C (4.59 mA cm−2) and 15 C (7.46 mA cm−2) at RT.

AI/ML

View Image Research Image 1
Four calculation conditions investigated in this research, (a) “ion + gas”; (b) “ion + sol”; (c) “ion pair + gas”; and (d) “ion pair + sol”, where “ion” refers to isolated ions, “ion pair” refers to cation–anion pair, “gas” represents gas phase, and “sol” means liquid phase.
View Image Research Image 2
The permutation of 74 cations and 30 anions forms an IL pool containing 2220 unique ILs. Employing RDKit, Psi4, and PyG to generate the molecular descriptors for the raw dataset. Unsupervised learning contains boxplots, pair plots, and hierarchical clustering, which are essential analytical methods for investigating the structure and correlations of variables in the dataset. Supervised learning leverages both regression and classification. The IL pool will initially be classified as a solid or liquid group.Finally, ECW>4V and σ≥5 mS cm−1 at room temperature is the final screening criterion for the final recommendation list of potential ILs.